2D Image Analysis Software
Capture, process, count, classify, measure and share.
A powerful and customizable imaging platform driven by over 30 years of user feedback, the new Image-Pro 10 offers native 64-bit support, a user-friendly interface and a suite of 2D measurement solutions.
Rely on our worldwide network of Image-Pro partners, superb training tools, and technical support team to help you get started and keep your research moving forward.
Image-Pro’s technique for performing Automatic Measurements is the foremost solution for gathering data from images by segmentation systems. Our simple step-wise approach to the problem is designed to provide the ultimate flexibility to analyse nearly any image type while remaining simple enough to quickly learn and teach to others.
Automatic Measurements
SEGMENT, COUNT/SIZE, CLASSIFY, and ANALYZE
Image-Pro’s technique for performing Automatic Measurements is the foremost solution for gathering data from images by segmentation systems. Our simple step-wise approach to the problem is designed to provide the ultimate flexibility to analyze nearly any image type while remaining simple enough to quickly learn and teach to others.
SEGMENT
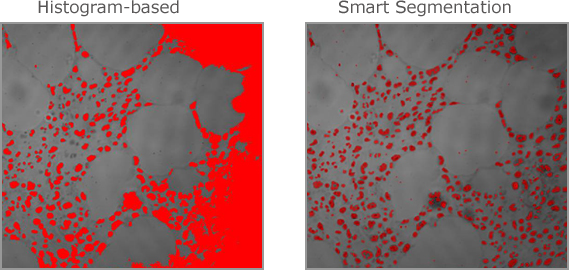
Histogram-based Segmentation
Use the method that best suites the image and identify what you want to measure
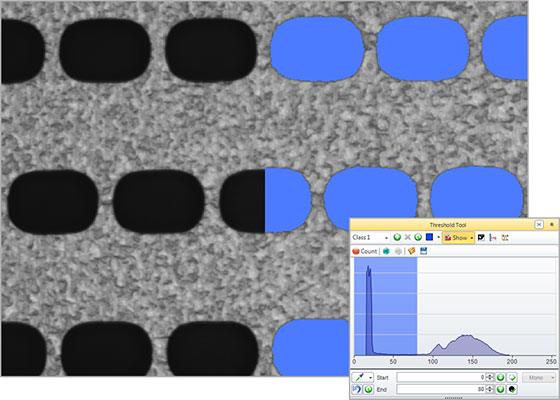
Select a single intensity range
Use histogram-based methods to select your areas of interest, instantly highlighting them as objects on the image. For high contrast images use the Auto Dark and Auto Bright methods
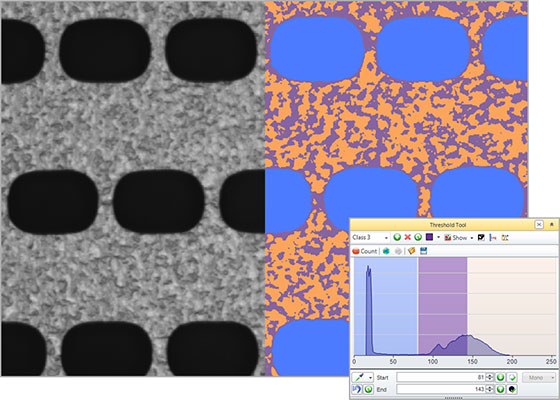
Don’t stop at a single range, add any number of classes to segment any range of intensities, whether contiguous or spaced apart on the histogram, classes can be a great way to find various materials in an image.
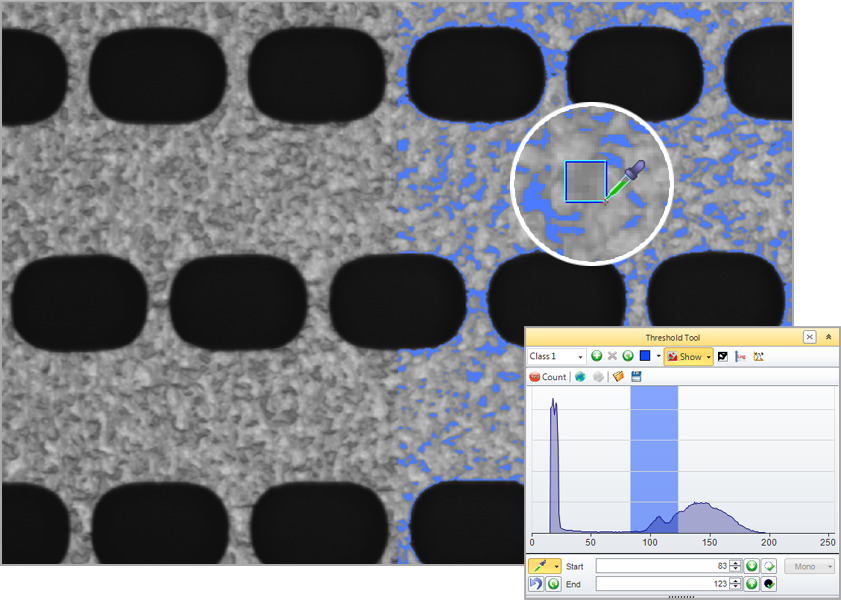
This simple, but handy, tool enables you to use a range of sizes for the picking area under the cursor and select those pixels as the representative selection on the histogram for your segmentation.
Smart Segmentation
A revolutionary new method that employs a pixel classification algorithm able to identify hard to segment objects and regions. Use Smart Segmentation to identify faintly-coloured objects, textured objects, and objects or regions on uneven backgrounds.
Select objects and background
Easily add object markers to the image to identify representative samples of your objects or regions and lastly add a background marker. Set up multiple object classes and even create select multiple regions per class to refine the representative pixels.

Define the recipe parameters
Use a range of “recipe” options to segment, including Intensity, Colour, Background and Morphological Filters. Once you have a recipe that fits your segmentation needs, you can save and reapply to other images. For more complex samples a custom option can pre-apply filters.

Train over multiple images
Most experiments require the acquisition of many images from one or more samples. Smart Segmentation makes this analysis easy because the algorithm can be trained over a range of images in order to learn how your objects should be most accurately segmented.

Smart Segmentation solves common problems
Automatically compensate for uneven backgrounds
Select two regions, and Smart Segmentation will automatically calculate the difference in the unevenly illuminated background. This is normally very difficult with histogram-based methods as objects will typically be the same intensity as some areas of the background.
Select & Classify Objects by Colour
Locate and segment objects based on their colour. Create new classes to further characterize and streamline data collection and reporting. Creating classes is easy, and doesn’t have a limit to how many you can create, in order to make it easy to organize important objects.

COUNT/SIZE
Create object outlines, instantly counted and sized
Filter by Measurement
Choose from a wide number of measurements to filter the entire segmentation group from and apply specific range restrictions (graphically or numerically) that selectively leave your objects of interest for further classification and measurement.
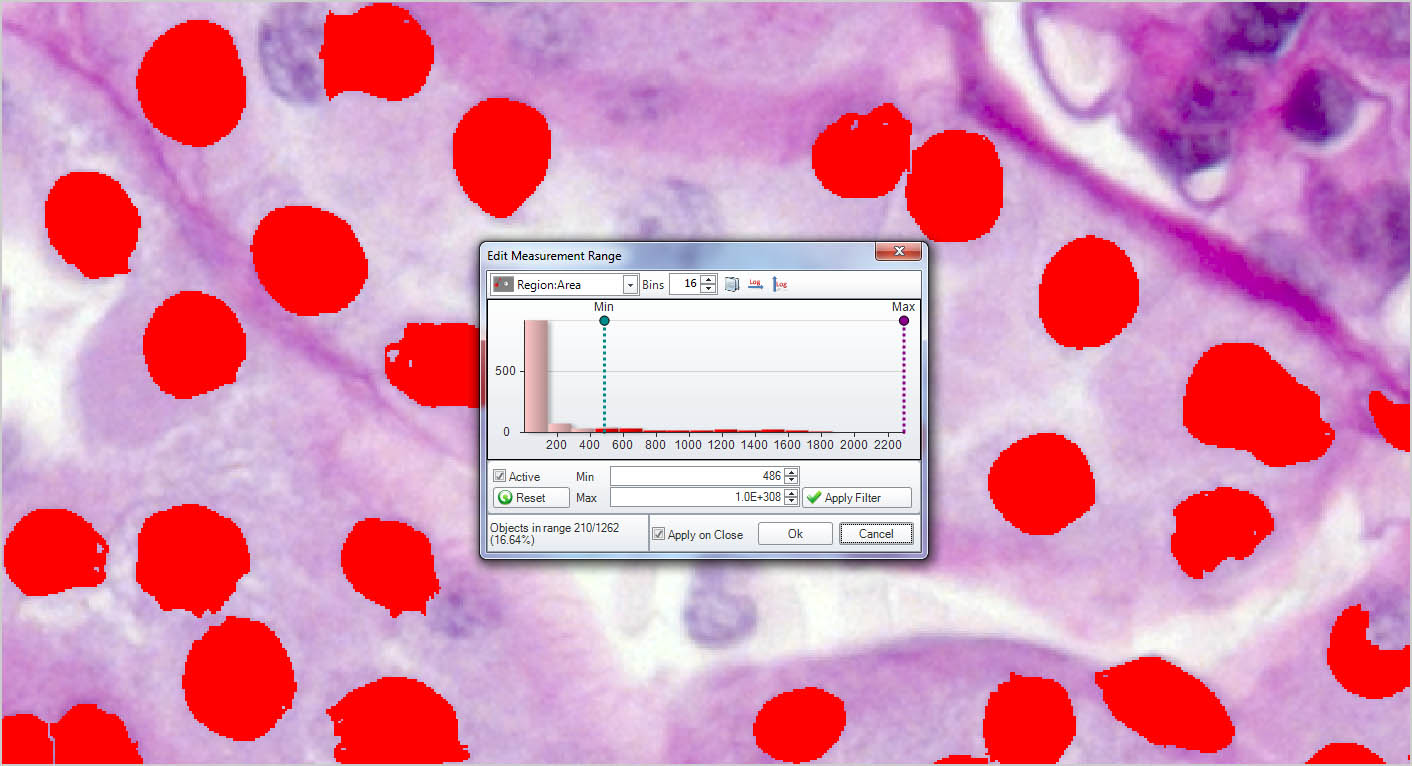
Area = ( 486 – Max ); Objects in range = 210
Filter out objects to be counted and sized by any number and combinations of parameters.

Area = ( 1486 – Max ); Objects in range = 57
Reduce the segmented objects down to the proper number and then press COUNT/SIZE.
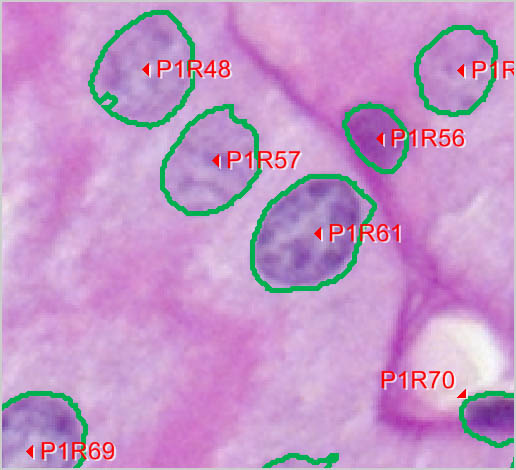
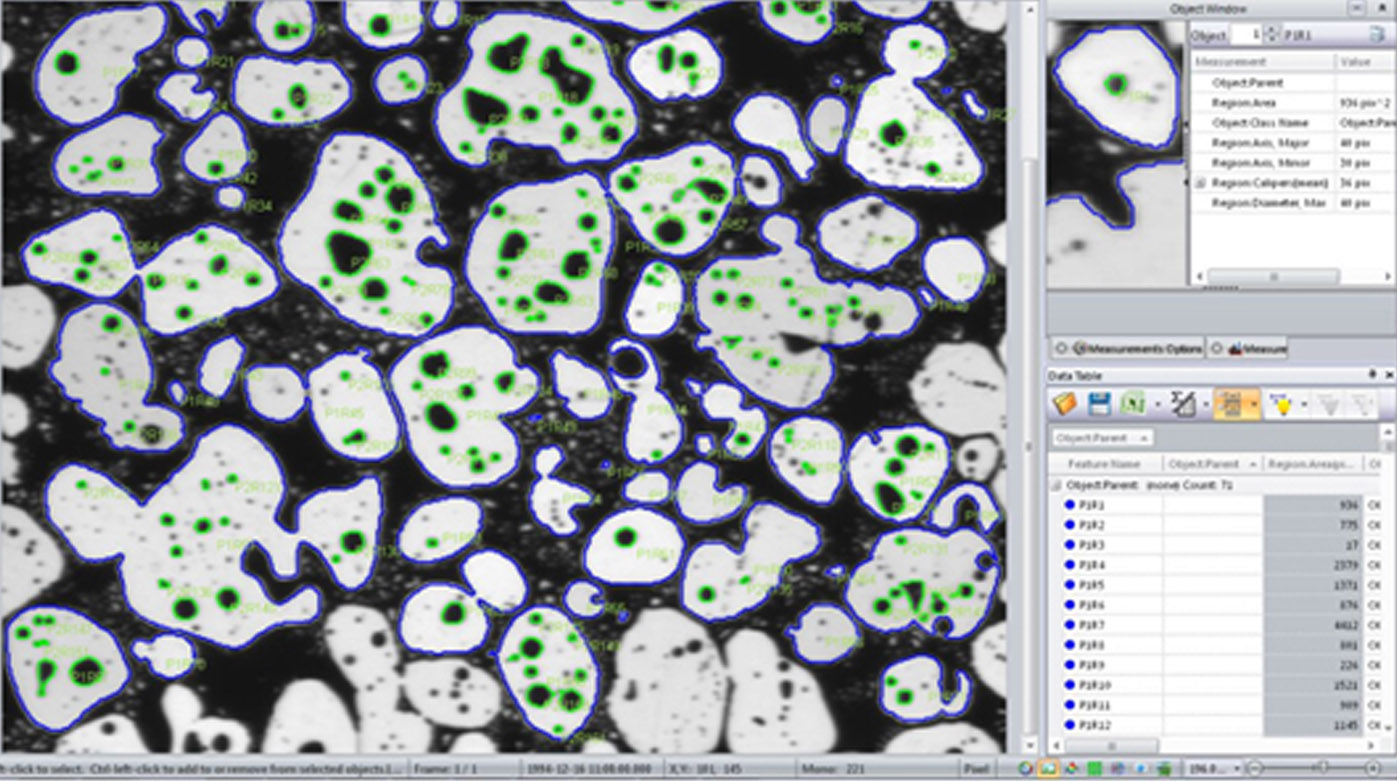
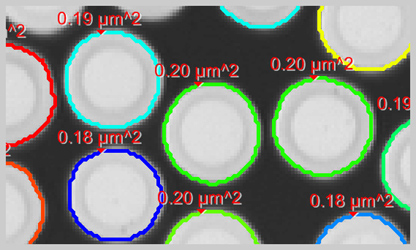
Create object outlines
Once objects are identified and outlined you can count and measure areas, percent area, regions, intensity values, and more.

All discrete, separate objects can be automatically counted within the set range of intensities
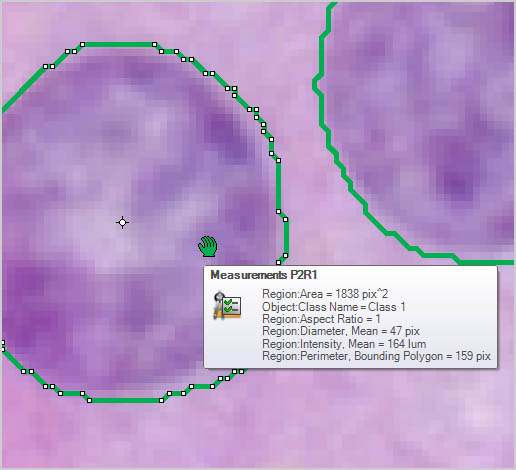
Automatically measure object area, percent area, perimeter, length & width, radii and ferret ratio, etc.
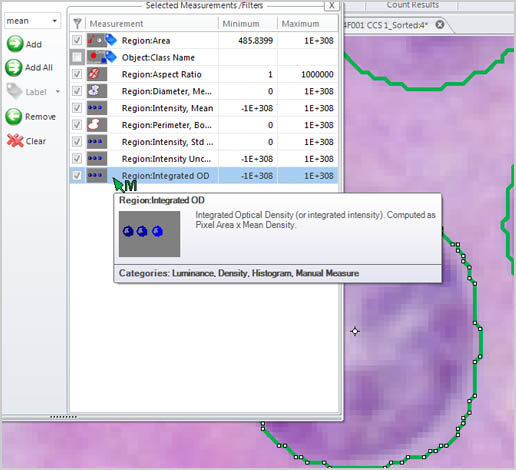
Automatically measure object intensity, integrated optical density, density, and intensity over time.
It becomes necessary to split touching objects in many images so we’ve provided both automatic watershed and boundary shape-based splitting techniques as well as a manual point-to-point and polyline-based splitting methods to get the job done.
Eliminate objects touching image border
In cases where you only want complete and intact volumes that are not cut off by the image stack’s borders you can enable a clean borders setting to ignore these objects.
This makes it easier to keep track of what’s what by allowing each object to receive a unique name and colour through the editing of the data table. Change a single object or select many objects and change them as a group.
Fill Holes
The appearance of each object is very important to accurate visualization so parameters for each object can be edited including colour, transparency, specularity.
CLASSIFY
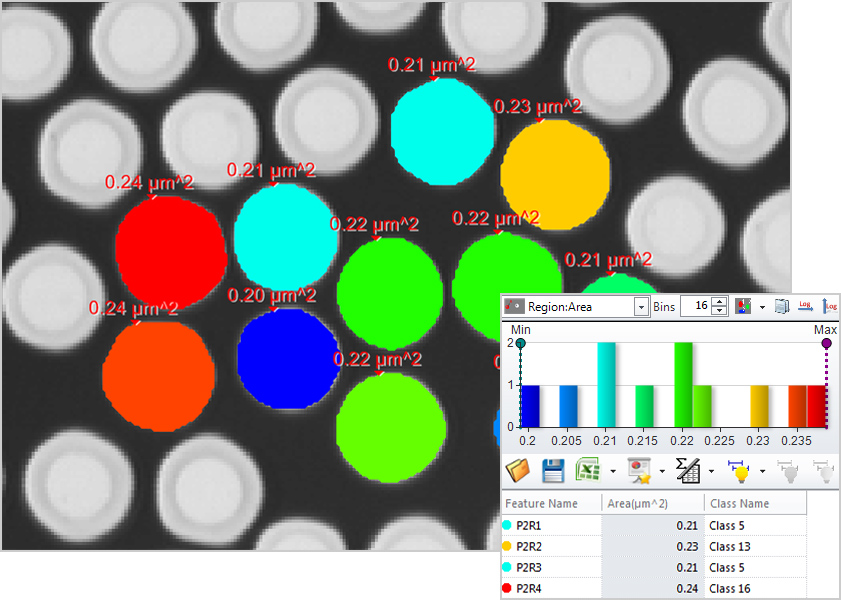
Separate objects into custom groups by parameter

Define any number of classification bins, set the first and last values of each bin, and assign classes to objects according to the bin ranges. Use any parameter in the measurement list to classify the objects by that “single” variable.
Define the number of groups to be created, choose all the measurement parameters to be used for the classification, and then apply hierarchical clustering to the objects. Classes will be assigned based on the cluster created by cutting the clustering tree where the number of branches correspond to the number of requested classes.


Classify objects using multiple parameters based on manually selected reference objects. This is an especially useful technique when you are not certain which parameters to use for the classification, but have some idea of how the objects should appear per class.
ANALYZE
Generate data for making helpful comparisons

Measure Distances Between Objects
Measure one-to-one and one-to-many distances between objects.
MeasureObjects within Objects
Analyze parent/child relationships with tools that allow you to automatically measure and group objects within objects.

Sort Counted Objects
Create a new image displaying all counted objects arranged by size

Analyze the Spatial Distribution of Objects
Measure and Analyze
Extract quantitative data with ease
Image-Pro 10 has been designed for a diverse user base and a multitude of applications. Whether in the materials science research lab, the quality assurance room, or the manufacturing floor, Premier 10’s semi-automated measurement and editing tools enable accurate and expedient analysis.
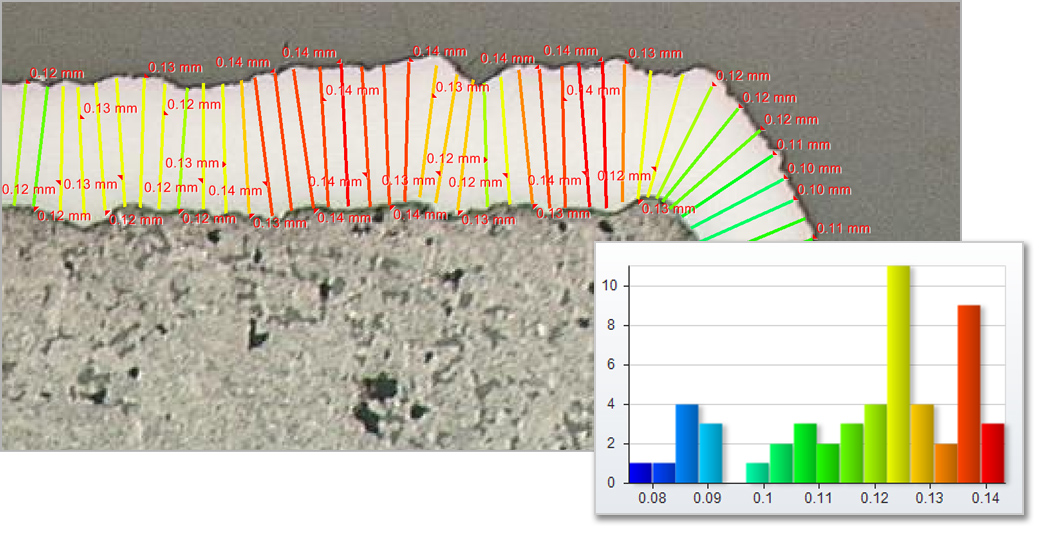
Calibration data is ideally read from the image, however is cases where it does not exist, we offer a variety of options to easily create and apply a calibration to an image
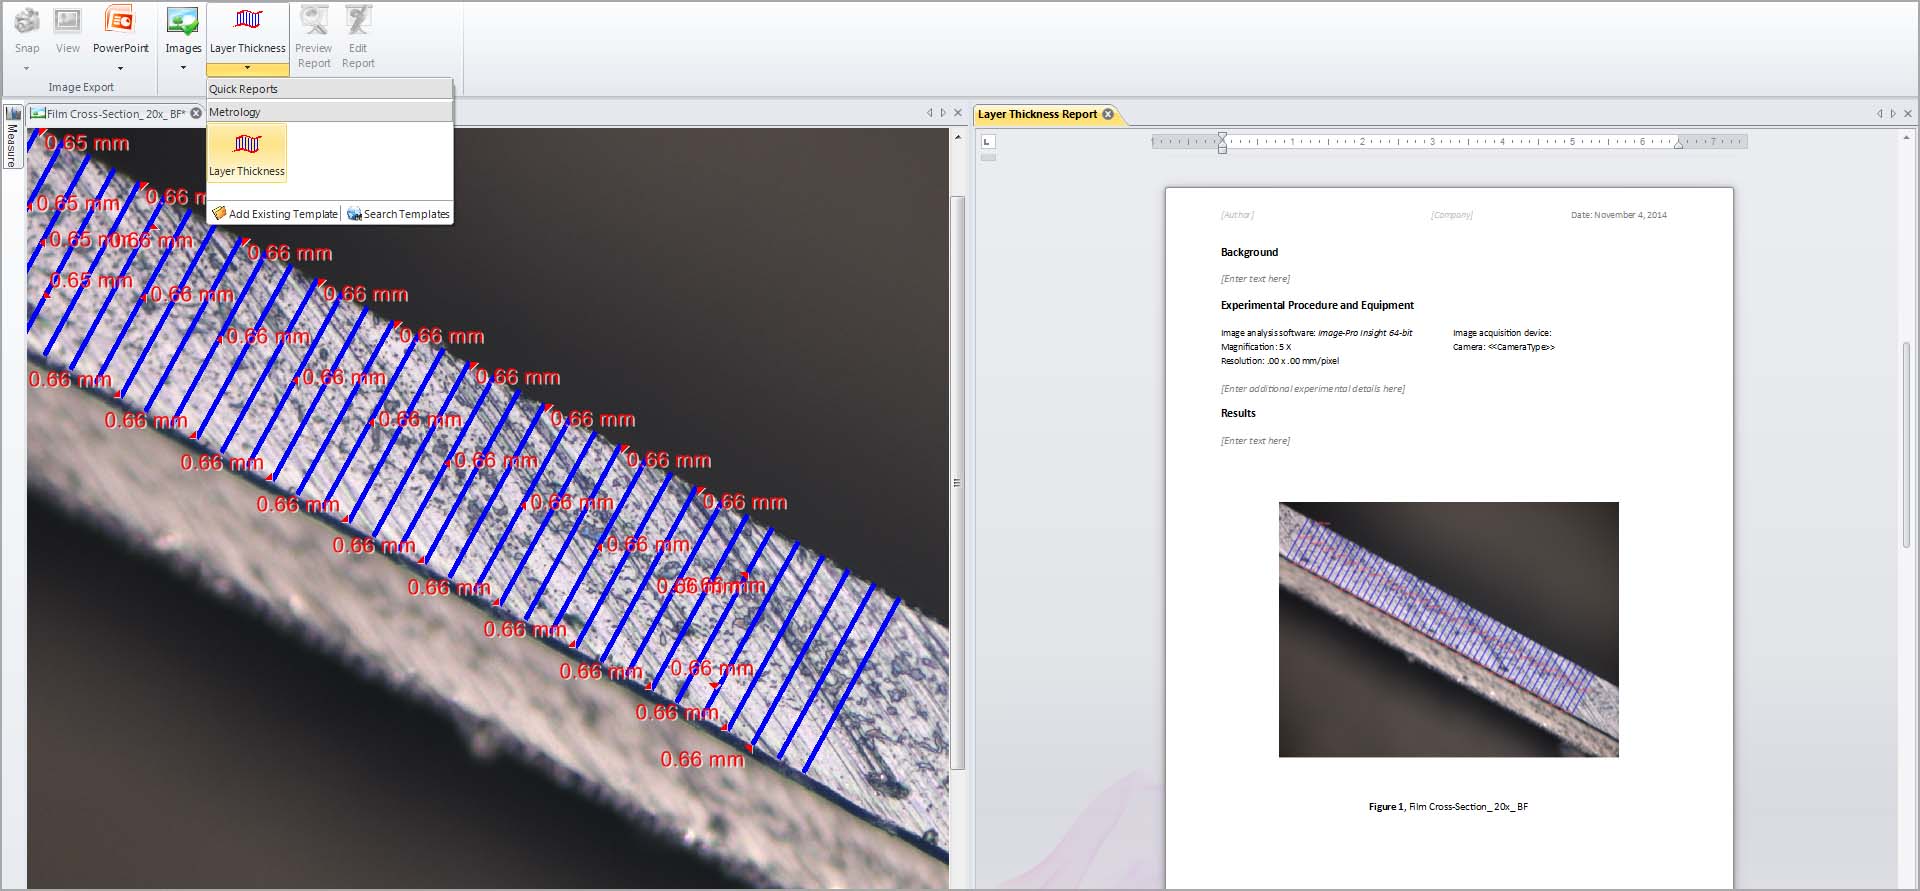
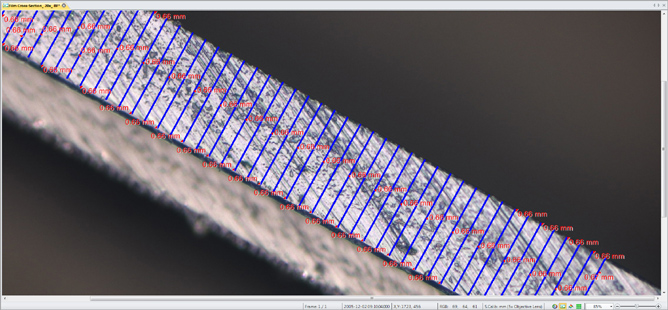
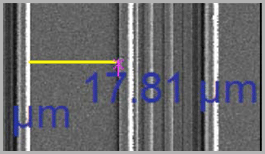
Determine the top and bottom edges and allow the software to measure thickness and statistics about longest and shortest lengths.
Draw a variety of lines and shapes for displaying the intensity under the lines as Line Profiles. Apply any number of line profiles and export the graph and data out to Excel or to a custom report.

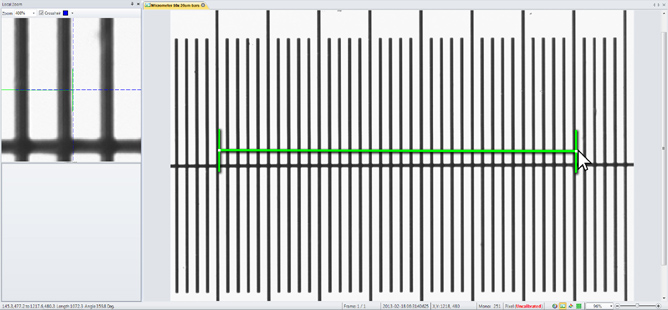
Measurement tools
Extract accurate data from your calibrated images with a wide range of manual and semi-automated measurement tools.
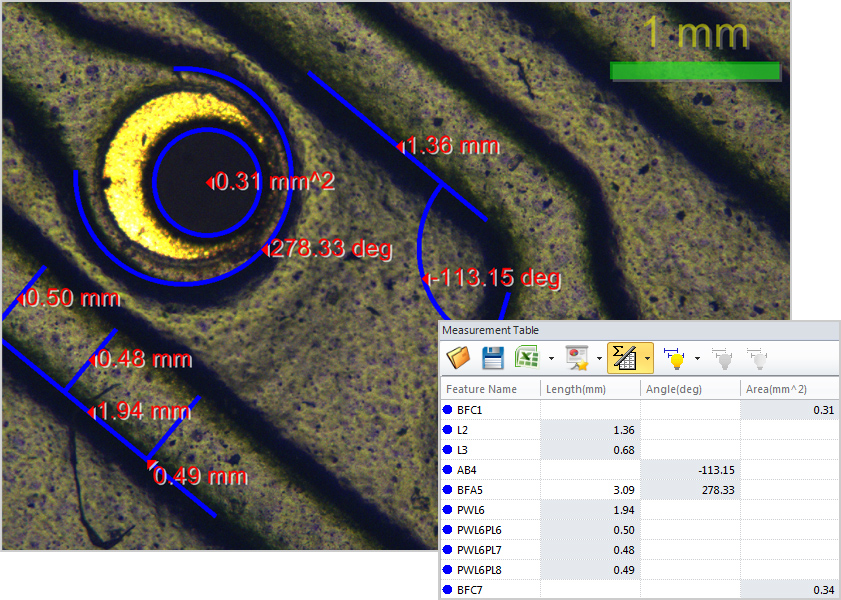
Draw polylines and regions to trace complex objects for you to measure area, perimeter, and length.
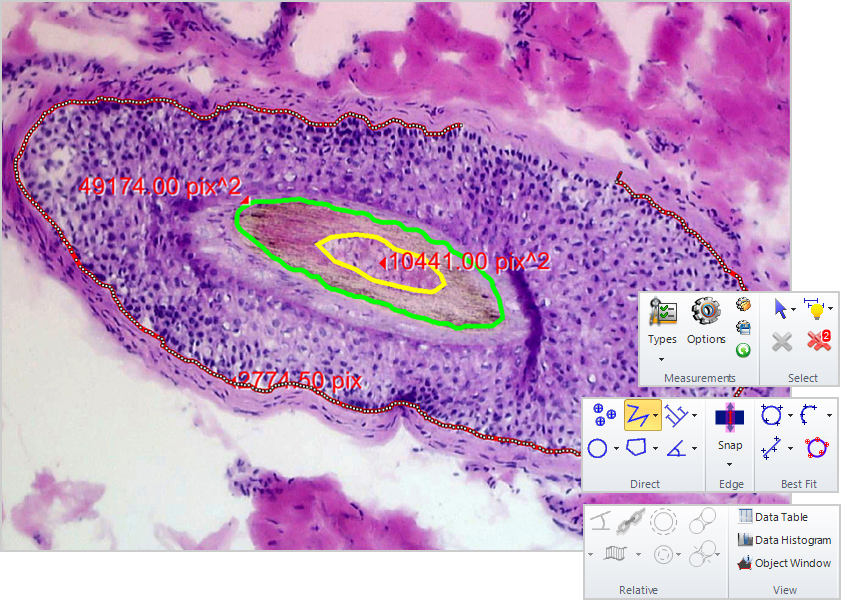
One-click automatic segmentation of the local area based on the pixels clicked. Refine selection with ‘Add’ and ‘Remove’.
Draw accurate line measurements every time with the Snap Measurement tools. Simply draw and the measurement will accurately snap along object edges
Use different colours, shapes, and custom names to classify and organize your measurement data. Use to organize measurements for greater clarity.
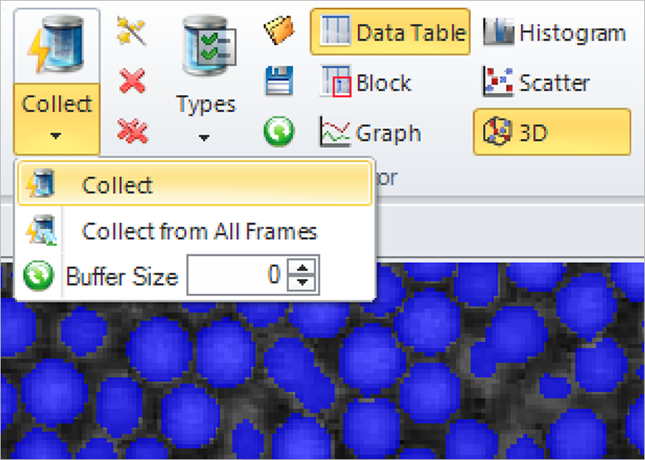
Data Collector
Gather data from multiple experiments
With the press of a button all the data from your table is compiled into Data Collector. You can even set it up to collect from all images automatically as they are measured
With the press of a button all the data from your table is compiled into Data Collector. You can even set it up to collect from all images automatically as they are measured

With the press of a button all the data from your table is compiled into Data Collector. You can even set it up to collect from all images automatically as they are measured

Export Data
Export your data and statistics to Microsoft Excel, File, or the Clipboard for pasting anywhere on your PC.
Send data to reports
Send your data and screenshots to custom designed reports within Image-Pro for fast and easy creation of experiment results.
Process and Enhance
Prepare your images
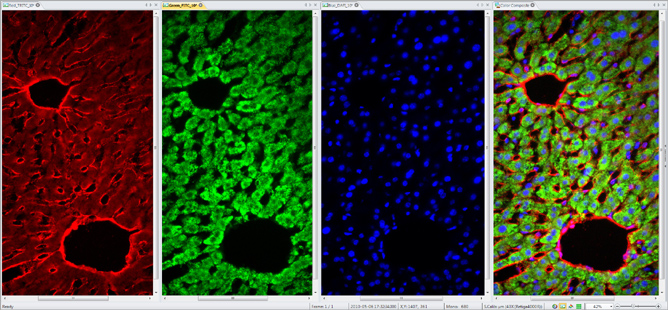
Build composite colour images by simply right-clicking on each grayscale image to select a colour tint.

Easily combine and separate images into RGB, HSI, and HSL colour channels.
Correct your image background to better distinguish image objects, improving the downstream measurement operations and reducing false positives.

Remove background noise and reveal hidden details with an extensive set of image processing filters. Preview filters on your active image for instant results.
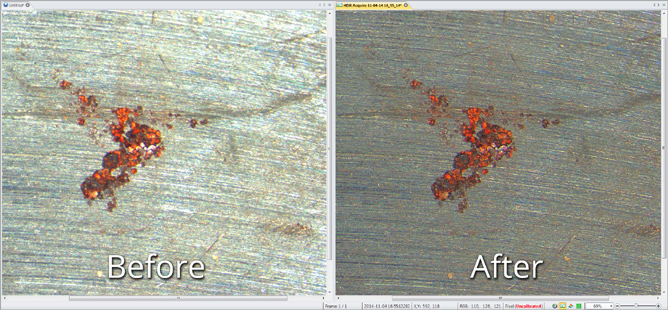
Capture a sequence of images at different exposures, with variable options, and combine them into a single High Dynamic Range image. The resulting image is a compilation of image data using the widest possible range of dark to light pixels. No more black or saturated pixels.
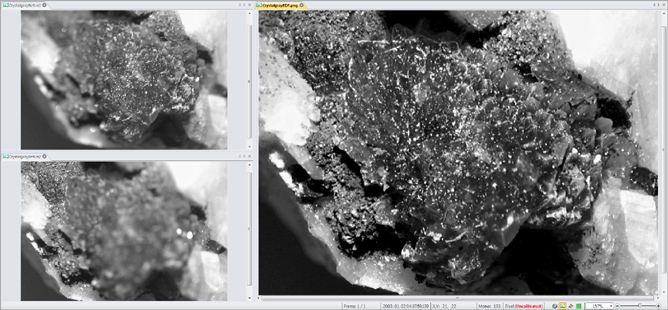
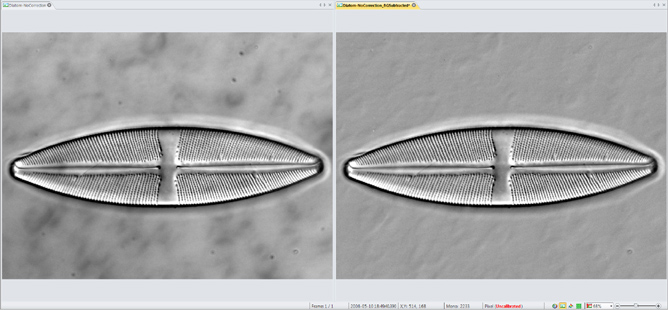
Correct for microscope shift with post-acquisition auto-alignment tools. Extended Depth of Focus (EDF) creates a focused image from a series of images captured at different z planes.
Report and Share
Prepare your images for what’s next
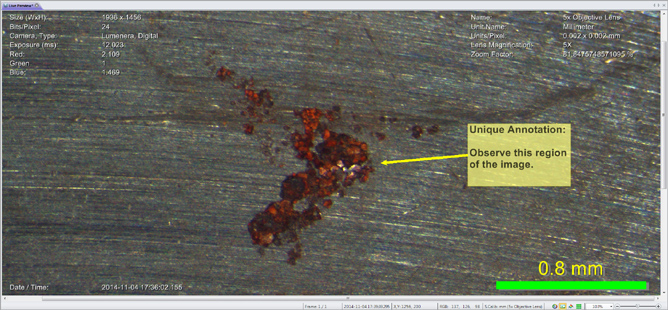
Draw arrows, text annotations, meta-data overlays, Date/Time stamps, calibration marker bars and more.
Send data and images to Premier 10’s report generator, able to create simple custom reports based on pre-defined templates. Print or export to Word or PDF.